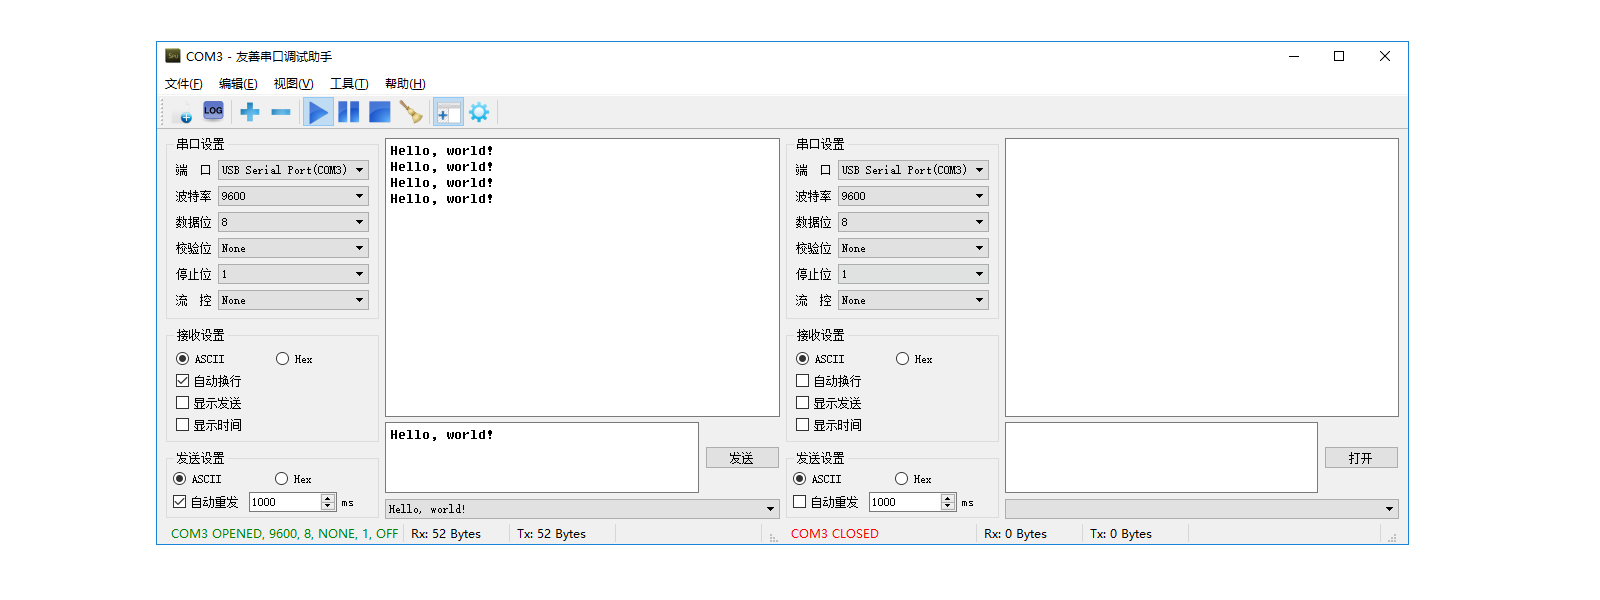
Multi-port monitoring
Capture multiple COM ports in one session for coordinated device debugging, master-slave comparison and post-incident review.
- Unified send/receive ordering
- Less window switching
- Fits gateway and master-slave test benches
Inspired by the cadence of Intel product pages, this view replaces dense paragraphs with fast-scanning modules so teams can quickly judge whether the tool fits the workflow at hand.
Capture multiple COM ports in one session for coordinated device debugging, master-slave comparison and post-incident review.
Inspect text and binary protocols precisely to isolate byte-level differences, encoding issues and CRC-related faults.
Debug TCP and UDP alongside serial traffic so gateway and protocol bridge issues stay in the same field of view.
Attach a timestamp to each line automatically for long-running captures, incident replay and post-delivery troubleshooting.
Full Modbus RTU and ASCII coverage for industrial control, field instruments and bus-level validation work.
Bring devices, licenses and message records into the backend so client-side diagnostics and platform operations stay connected.
Use it for protocol debugging in development, interaction validation in testing and device-license coordination in operations.
Use it during MCU, sensor and board bring-up to verify low-level serial links and protocol exchange quickly.
Fits PLC, meter and industrial device communication checks, helping isolate master-slave link and timing issues.
In serial-to-TCP or UDP gateway scenarios, you can validate physical-port and network-side traffic side by side.